
Observability

Wow exposes two different views of the same runtime pipeline:
- Metrics aggregate finite operations, receiver streams, and batch activity with bounded Micrometer tags.
wow-opentelemetrycreates OpenTelemetry spans and propagates message trace context across command, event, state, persistence, and wait boundaries.
Use metrics to locate a failing or slow stage, then use traces to follow one execution. Neither signal replaces backend reconciliation, projection-lag checks, or deployment evidence.
What the OpenTelemetry module instruments
The Spring starter registers five processing filters and decorates supported infrastructure beans:
| Runtime stage | Instrumentation scope | Representative span name |
|---|---|---|
| Command publication | me.ahoo.wow-commandProducer | <aggregate>.<command>.command send |
| Aggregate execution | me.ahoo.wow-aggregate | <aggregate>.<command> |
| Event persistence | me.ahoo.wow-eventStore | <aggregate>.<event>.event.append, <aggregate>.event.load |
| Domain/state publication | me.ahoo.wow-eventProducer, me.ahoo.wow-stateEventProducer | <aggregate>.<event>.event send, <aggregate>.<event>.state_event send |
| Event processing | me.ahoo.wow-eventProcessor, -projection, -statelessSaga | Event-function qualified name |
| Snapshot processing/storage | me.ahoo.wow-snapshot, -snapshotStore | <aggregate>.snapshot, .snapshot.save, .snapshot.load, .snapshot.version |
| Command wait plan | me.ahoo.wow-wait | <aggregate>.<command>.waiting |
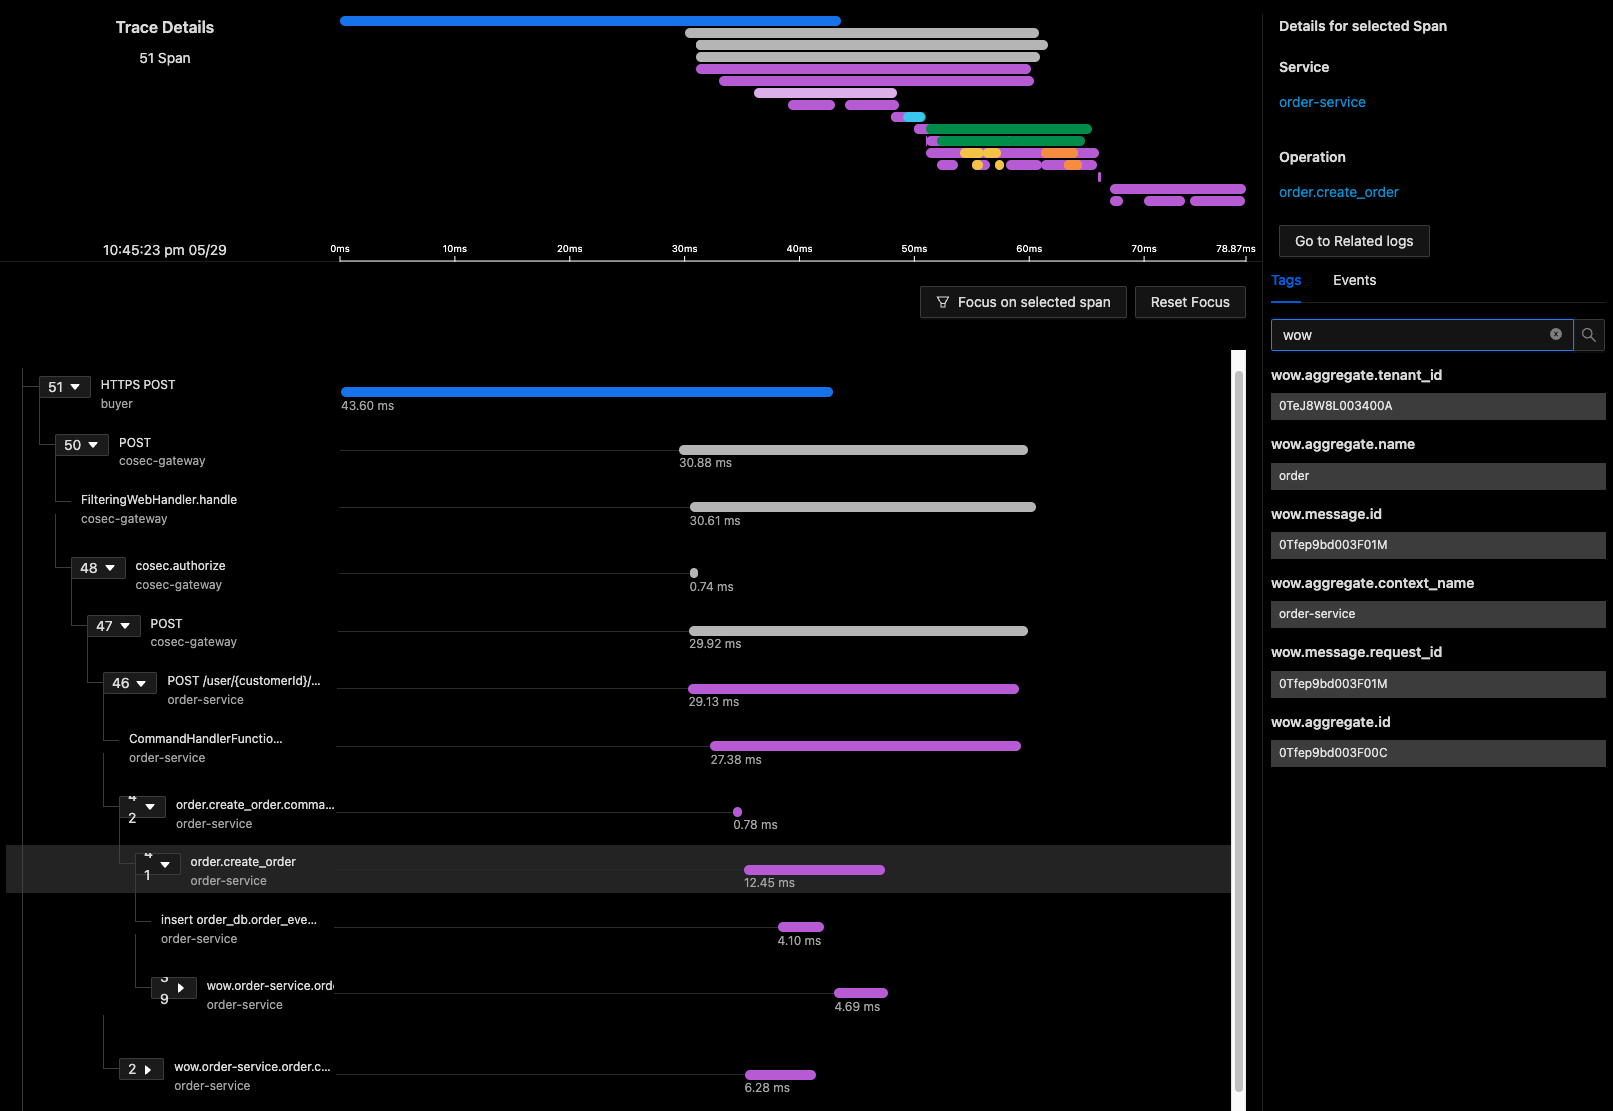
Instrumenters that register MessageAttributesExtractor or ExchangeAttributesExtractor add wow.message.id, optional wow.message.request_id and wow.message.trace_id, plus wow.aggregate.context_name, wow.aggregate.name, wow.aggregate.id, and wow.aggregate.tenant_id when an aggregate identity is present. Store operations that use AggregateIdAttributesExtractor add only the aggregate attributes. WaitPlanInstrumenter registers no attribute extractor, so the .waiting span does not automatically receive these Wow message or aggregate attributes. These are trace attributes, not low-cardinality metric tags.
Producer instrumenters inject the OpenTelemetry propagation headers into the Wow message header; consumer filters extract them. TraceMono and TraceFlux restore the OpenTelemetry Context for subscription and asynchronous signals, and end the span on completion, error, or cancellation. The wait decorator preserves the command gateway's runtime receiver/admission contract.
All instrumenters capture GlobalOpenTelemetry when their singleton objects initialize. Initialize the SDK before the Wow ApplicationContext creates filters or decorators. The OpenTelemetry Java Agent satisfies this ordering because it starts before application bootstrap.
Correlating Your Own Spans
Create business spans only around meaningful remote calls or expensive domain work. Keep aggregate IDs out of metric tags; they are appropriate trace attributes.
In a Command Handler
Wow makes its span current while invoking the nested work, so use Context.current() explicitly as the parent and scope the business call:
import io.opentelemetry.api.GlobalOpenTelemetry
import io.opentelemetry.context.Context
private val tracer = GlobalOpenTelemetry.getTracer("order-domain")
@OnCommand
fun handle(command: CreateOrder): OrderCreated {
val span = tracer.spanBuilder("inventory.validate")
.setParent(Context.current())
.setAttribute("order.item_count", command.items.size.toLong())
.startSpan()
return try {
span.makeCurrent().use {
validateItems(command.items)
OrderCreated(command.id)
}
} catch (error: Throwable) {
span.recordException(error)
throw error
} finally {
span.end()
}
}This example is synchronous. Do not leave a scope open across an asynchronous boundary or a different thread.
In a Reactive Handler (Mono/Flux)
Build the span at subscription time, and end it from the complete Reactor lifecycle:
@OnEvent
fun onOrderCreated(event: OrderCreated): Mono<Void> = Mono.defer {
val span = tracer.spanBuilder("order_summary.save")
.setParent(Context.current())
.setAttribute("order.id", event.orderId)
.startSpan()
Mono.defer {
orderSummaryRepository.save(buildSummary(event))
}.doOnError(span::recordException)
.doFinally { span.end() }
.then()
}The inner Mono.defer is intentional: synchronous exceptions from buildSummary or save become error signals before doOnError and doFinally are attached. Completion, error, or cancellation therefore ends the span once.
If custom operators escape the instrumented subscriber chain, propagate an OpenTelemetry Context deliberately and cover that boundary with an integration test. The module tests verify restoration across publishOn, nested traced publishers, cancellation, and source errors.
For one incident, follow this evidence chain:
- select the metric stage and time window by
component,operation,context,aggregate, andoutcome; - find a matching trace by service, operation, aggregate, request ID, or message ID;
- confirm the span reaches the expected store and downstream processor;
- reconcile the final backend version/read model and deployment revision separately.
Installation
For a Spring Boot application, request the starter capability so auto-configuration is present:
implementation("me.ahoo.wow:wow-spring-boot-starter") {
capabilities {
requireCapability("me.ahoo.wow:opentelemetry-support")
}
}For non-Spring composition, depend directly on the module and apply the Tracing.tracing() decorators yourself:
implementation("me.ahoo.wow:wow-opentelemetry")<dependency>
<groupId>me.ahoo.wow</groupId>
<artifactId>wow-opentelemetry</artifactId>
<version>${wow.version}</version>
</dependency>Exporter setup and the wow.opentelemetry.enabled switch are documented in Observability Configuration.