
Event Compensation Example
compensation is a runnable Wow application and operator console. This page owns runtime and operator verification. See Event Compensation for immediate retry, the ExecutionFailed state machine, and replay semantics, and Compensation Configuration for complete properties.
Modules and Verification Baseline
| Module | Runtime responsibility |
|---|---|
wow-compensation-api | Command, event, state, and query contracts |
wow-compensation-domain | ExecutionFailed aggregate and backoff calculation |
wow-compensation-core | Failure capture, result write-back, and source-event replay |
wow-compensation-server | Snapshot query, scheduling, OpenAPI, notification, and Dashboard hosting when a frontend build is present |
dashboard | Compensation posture, failure queues, details, and operator actions |
Check the domain, core, and console first:
./gradlew :wow-compensation-domain:check :wow-compensation-core:check
pnpm --filter wow-compensation-dashboard^... build
pnpm --dir compensation/dashboard exec vitest run
ExecutionFailedSpec covers prepare, force prepare, success, another failure, and retry-specification changes. CompensationFailureRecorderTest covers the recorder's error boundaries, ExecutionFailedWireGoldenTest locks the command bodies, while Dashboard tests cover queue conditions and action state. Successful commands prove only these local gates, not real messaging, storage, notifications, or a deployment environment.
Local Service Startup, Health, and Route Check
The current default JVM arguments for :wow-compensation-server:run enable JMX on port 5555 without authentication or TLS. For the smallest safe local route check, build the distribution and use plain java bound only to loopback. installDist copies an existing compensation/dashboard/dist; it does not build the frontend, so this flow does not verify Dashboard assets when that output is absent.
./gradlew :wow-compensation-server:installDist

SERVER_PORT=18083 \
SERVER_ADDRESS=127.0.0.1 \
SPRING_AUTOCONFIGURE_EXCLUDE='org.springframework.boot.elasticsearch.autoconfigure.ElasticsearchClientAutoConfiguration,org.springframework.boot.elasticsearch.autoconfigure.ElasticsearchRestClientAutoConfiguration,org.springframework.boot.data.redis.autoconfigure.DataRedisReactiveAutoConfiguration,org.springframework.boot.mongodb.autoconfigure.MongoAutoConfiguration,org.springframework.boot.mongodb.autoconfigure.MongoReactiveAutoConfiguration' \
COSID_MACHINE_DISTRIBUTOR_TYPE=manual \
COSID_MACHINE_DISTRIBUTOR_MANUAL_MACHINE_ID=1 \
WOW_COMPENSATION_SCHEDULER_ENABLED=false \
WOW_COMPENSATION_WEBHOOK_WEIXIN_URL=false \
WOW_KAFKA_ENABLED=false \
WOW_COMMAND_BUS_TYPE=in_memory \
WOW_EVENT_BUS_TYPE=in_memory \
WOW_EVENTSOURCING_STATE_BUS_TYPE=in_memory \
WOW_EVENTSOURCING_STORE_STORAGE=in_memory \
WOW_EVENTSOURCING_SNAPSHOT_STORAGE=in_memory \
WOW_PREPARE_ENABLED=false \
WOW_MONGO_ENABLED=false \
WOW_REDIS_ENABLED=false \
WOW_ELASTICSEARCH_ENABLED=false \
java \
  -Dspring.config.location=file:compensation/wow-compensation-server/src/main/resources/application.yaml \
  -cp 'compensation/wow-compensation-server/build/install/wow-compensation-server/lib/*' \
  me.ahoo.wow.compensation.server.CompensationServerKt
Expect Netty started on port 18083 and Started CompensationServerKt. Verify the same address and port from another terminal:
curl -fsS http://127.0.0.1:18083/actuator/health/liveness
curl -fsS http://127.0.0.1:18083/v3/api-docs | \
  jq -r '.paths["/execution_failed/{id}/prepare_compensation"].put.operationId'
Expect {"status":"UP"} and compensation.execution_failed.prepare_compensation. These checks prove only service startup, the health endpoint, and presence of the prepare route. They do not request Dashboard assets, send a compensation command, or execute a state transition, so they do not verify the Dashboard or local state machine. This mode also loses data when the process exits and disables automatic scheduling; it is not durable-recovery evidence.
Run and verify the Dashboard separately:
pnpm --filter wow-compensation-dashboard^... build
pnpm --dir compensation/dashboard dev
Compensation Control Plane
The console is built on the Wow view engine (@ahoo-wang/wow-view-engine): the figures, lists, filters, paging, export, detail drawer and charts are the engine's, and the console declares only compensation's definitions (fields, system views and a system board, in compensation/dashboard/src/views/) and hooks up the domain commands. The data comes straight from the existing query routes rather than a dedicated analytics backend:
- Snapshot:
POST /execution_failed/snapshot/{paged,aggregation}; - EventStream:
POST /execution_failed/event/{paged,aggregation}; - Capability descriptors:
GET /execution_failed/{snapshot,event}/schema. The console reads them first and narrows its definitions to the operators, sorts, groups and limits the server actually admits: a capability the server does not list is not offered, so no query bound to be refused is sent.
| Address | Page |
|---|---|
/ | Overview: the "Compensation overview" system board, embedded read-only |
/executions | Failed executions: the records-and-analysis workbench whose system views are the seven queues |
/events | Event stream: the workbench over the compensation event streams (where an event-stream panel's "Open in the workbench" lands) |
/boards | Boards: the dashboard workbench, to save as, rearrange, or build boards of your own |
The four places are in the top bar. The old queue addresses (/to-retry and the rest), /dashboard and /analytics are gone with the old shell and open the overview. Notification links point at /executions?view=…&id=…. The failed-executions page keeps ?view= itself rather than through the engine's address handling, because a link's narrowing (?cluster=, ?start&end) has to leave the address in the same step as the view it narrows; so a ?view= naming a deleted view shows "This view could not be opened" with "Open the default view", where the engine's own handling (/events, /boards) goes to the default view at once.
Reading the Overview
| Panel | Question answered | Measurement |
|---|---|---|
| Active in range / All active | How large is the backlog, and how much does the range cover? | Active = FAILED / PREPARED; "in range" follows the time range, "all" does not |
| Actionable now / Timed out / Unrecoverable | How many can be handled, are stuck, or were given up? | "Actionable now" is the due-for-retry queue; "Timed out" is PREPARED with timeoutAt before the server's now |
| New failures / Prepared / Retry failed / Retry succeeded | Inflow and outcomes | Event streams holding the event, with a daily trend; the figure is the whole range |
| Net backlog / Retry success | Is it improving? | New failures − Retry succeeded; Retry succeeded / (Retry failed + Retry succeeded), derived by the server from counts by event name |
| Failure clusters — top 5 | Where does the pressure concentrate? | Context × processor × function × error code (the function kind, which the first three fix, is left out), with the active count, the oldest execution and the earliest next retry; "Open in the workbench" opens the "Failure clusters" view with all five identity columns and the split by status; a row opens the Active view narrowed to that cluster and the range |
| Recoverability / Retries of active failures | Are current records recoverable, and how many retries have they used? | Active snapshots in the range; retries in the bands 0, 1–2, 3–5, 6+ |
| Needing attention — due for retry | Which to handle first | Ordered by next retry, oldest first; the row and bulk commands are those of Failed executions |
The time range is the board's one filter, "last 7 days" by default (today and the six whole days before), and constrains both Snapshot state.executeAt and EventStream createTime; its value is kept in the browser history entry. "Updated" is the earliest time any panel on screen was read, and the refresh button beside it reads the whole board again; a panel that fails says why inside itself only. Any panel can fill the screen.
These metrics are operator signals, not business reconciliation or proof of recovery. Prepared means replay preparation was accepted, while Succeeded means the target function completed on that compensation attempt; external side effects still require reconciliation through stable idempotency keys.
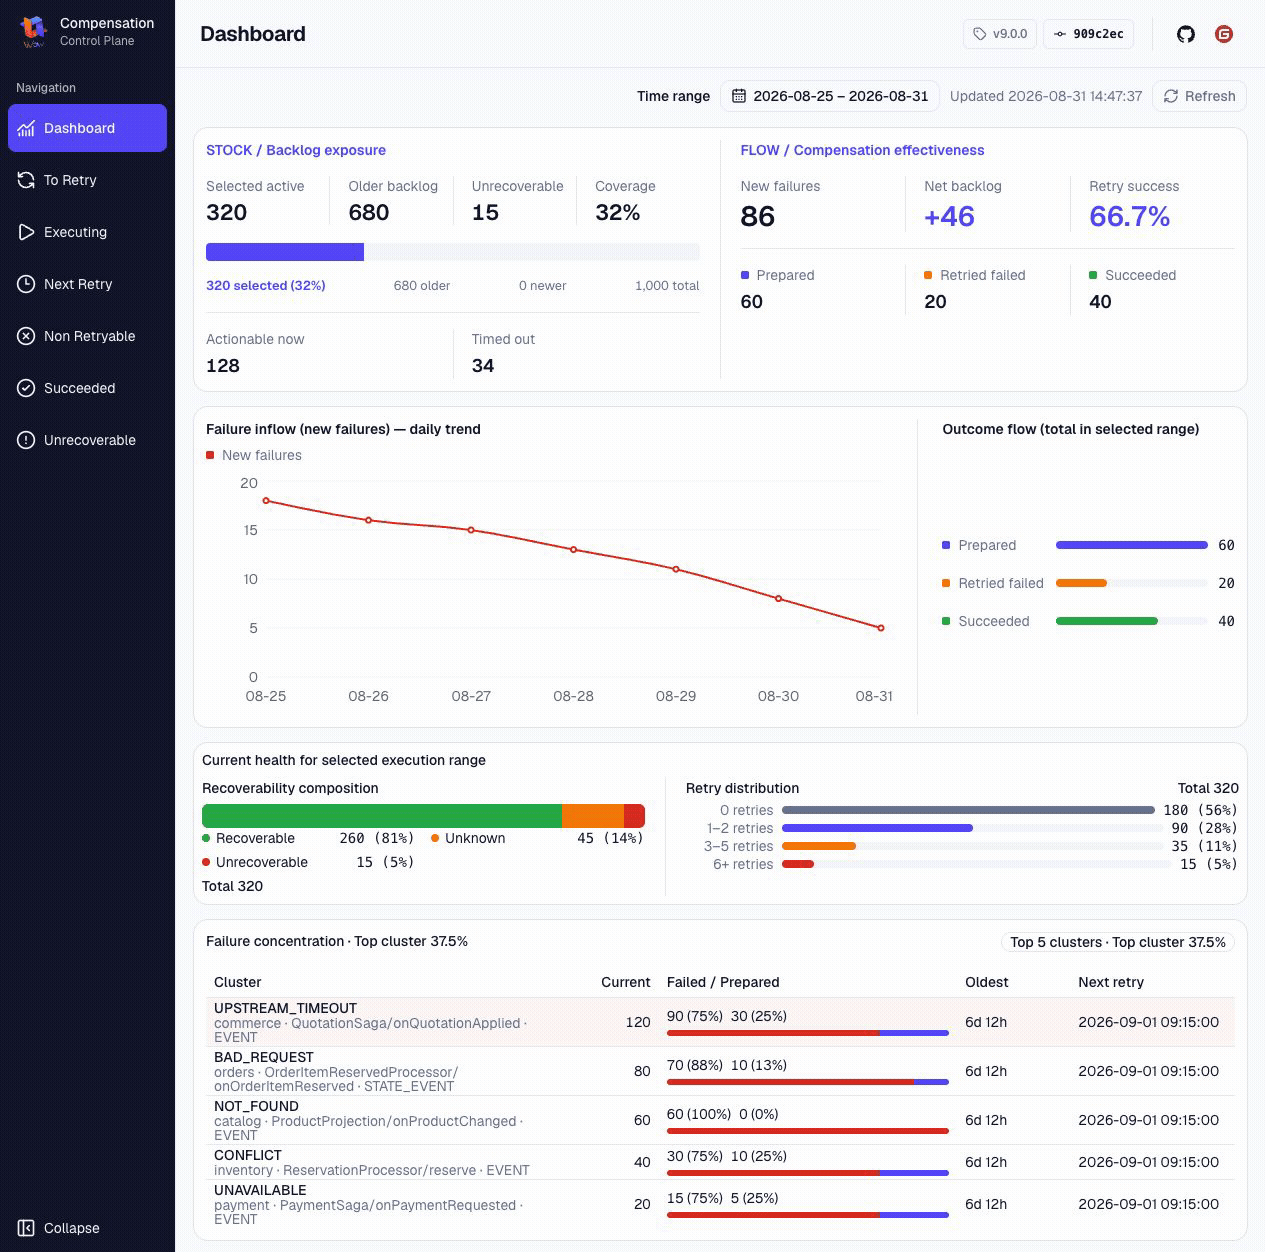
This screenshot is a browser rendering against a real compensation server on MongoDB, with demonstration data written locally; the values are not production metrics.
Queues, Filters and Operator Actions
The system views of Failed executions:
| View | Condition |
|---|---|
| Active | FAILED / PREPARED |
| To retry | RECOVERABLE / UNKNOWN records below the limit that are FAILED or timed-out PREPARED |
| Executing | PREPARED records that have not timed out (timeoutAt not before the server's now) |
| Due for retry | To-retry records whose nextRetryAt has come: the automatic-scheduling candidates |
| Non-retryable | Active records at the ordinary retry limit |
| Unrecoverable | Active UNRECOVERABLE records |
| Succeeded | SUCCEEDED history |
| All, and four analyses | By status, active failures by processor, new failures per day, and failure clusters (every column of the overview's cluster panel) |
"Now" is the server's clock, read at each query (BEFORE_NOW / AFTER_NOW, which need a Wow 9.2.0 server or later), the same boundary the command side's timeout check uses.
- Filters: any field of the definition, combined with the operators its kind offers (and / or / not). "Search errors" is a full-text search of the error message and stack trace and appears only where the storage supports it: an Elasticsearch snapshot store does; a MongoDB snapshot store lists it in its descriptor only once the collection has a text index.
- Views: columns, sort, the card layout and conditions can be saved as a view, and boards as well. Nobody signs in to the console, so views and boards are shared: they are kept in the view store the compensation service embeds (
wow-view-store-starter,/view-store/tenant/(0)/owner/(shared)/…), and everyone who opens the console sees and can change them. - Export: CSV of the current condition or the selection, with formulas neutralised by default.
- Detail: a row (or Enter) opens a side drawer that reads the record in full by field group, with the stack trace (line numbers, wrap, copy), the "Change function" and "Apply retry specification" forms, and the execution history; a history row opens that event's full payload. The open record is in the address (
?id=), so it can be sent as a link.
Available actions (per row, in the detail header, and on the toolbar for a selection):
- Prepare: ordinary preparation, subject to state, timeout, and retry limit;
- Force prepare: after confirmation, cross the retry limit but not success or an unexpired
PREPARED; - Mark recoverable: change recoverability and therefore automatic-scheduling eligibility;
- Apply retry spec: change non-negative
maxRetries,minBackoff, andexecutionTimeout; - Change function: change context, processor, function name, and
EVENT/STATE_EVENTkind.
A bulk command asks first (with the count, and the records the console already knows it will not send, with why), sends four at a time and waits for the snapshot (Command-Wait-Stage: SNAPSHOT); it can be stopped, and records the server refuses stay selected with the server's reason. Whether a button is enabled is only a hint: the server state machine decides.
The current UI has no delete or deleted-aggregate recovery button and defines no operator role model, approval flow, or audit-retention policy. A deployment must supply those controls through network, authentication, authorization, and audit layers.
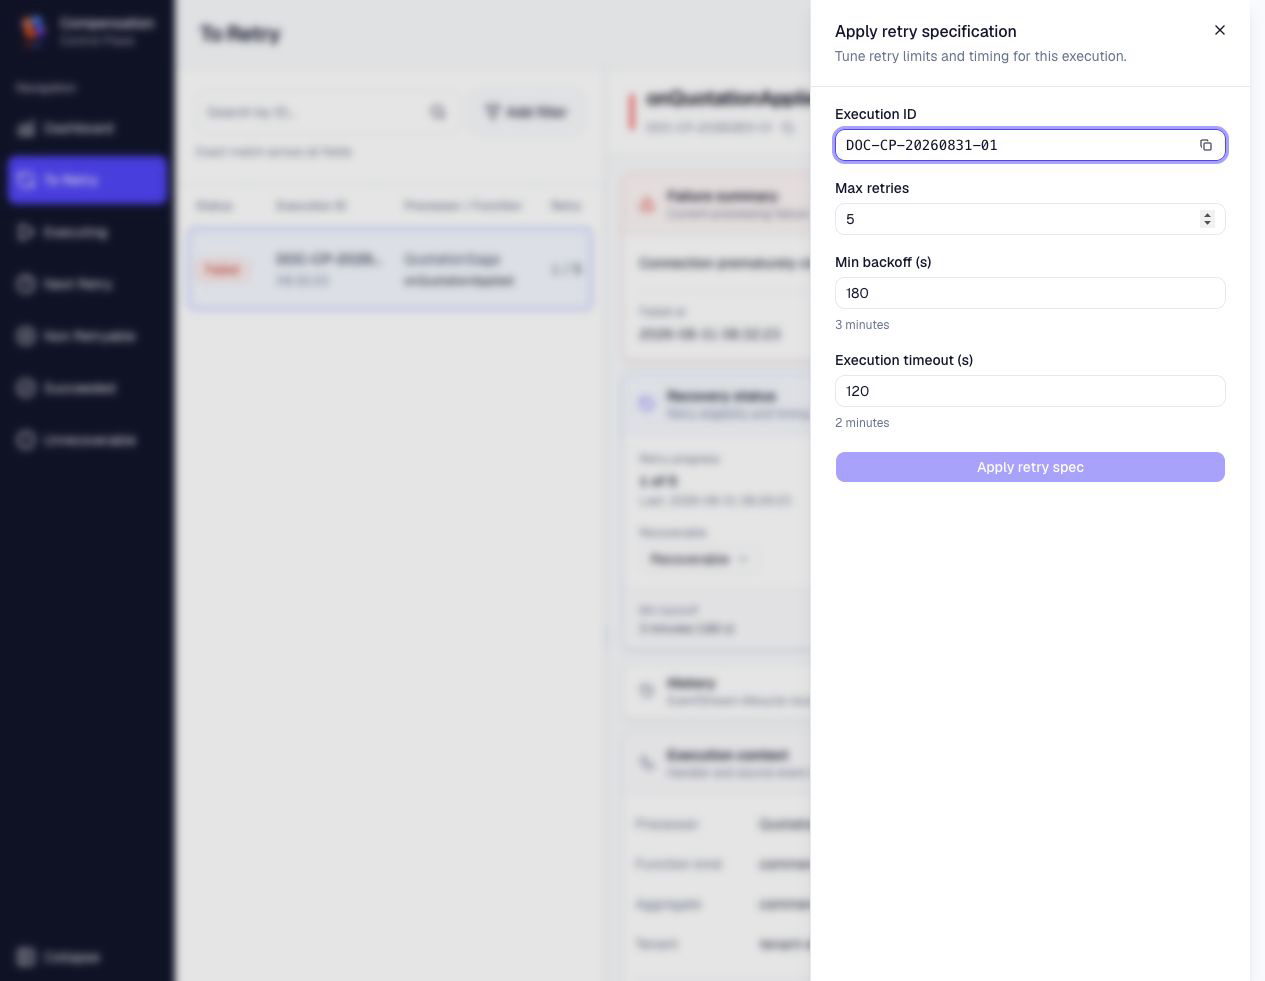
This screenshot also comes from a real server; the server state machine remains authoritative for every action.
Management Endpoints
The generated Dashboard client currently uses an empty basePath, so its default command routes are:
| Action | Route |
|---|---|
| Ordinary prepare | PUT /execution_failed/{id}/prepare_compensation |
| Force prepare | PUT /execution_failed/{id}/force_prepare_compensation |
| Change retry specification | PUT /execution_failed/{id}/apply_retry_spec |
| Change recoverability | PUT /execution_failed/{id}/mark_recoverable |
| Change target function | PUT /execution_failed/{id}/change_function |
An API Gateway may add an external context prefix; the running instance's OpenAPI is the final route evidence. The generated client also contains default aggregate delete and recovery routes, but the current Dashboard does not call them.
Prepare an existing retryable record:
curl -X PUT \
  'http://127.0.0.1:18083/execution_failed/<execution-id>/prepare_compensation' \
  -H 'Command-Wait-Stage: PROCESSED' \
  -H 'Command-Request-Id: prepare-<execution-id>'
succeeded=true and stage=PROCESSED prove only that the prepare command was handled. A later read may still see the old FAILED, a brief PREPARED, or final SUCCEEDED / new FAILED. To observe the complete result, poll snapshot/event queries and inspect state-event history instead of asserting one immediate read.
Verify failure paths too. Ordinary prepare rejects SUCCEEDED, an unexpired PREPARED, and a record at the limit. Force prepare still rejects success and an unexpired state. Applying success/failure directly to a non-PREPARED record returns ExecutionFailed is not prepared. Dashboard button state is guidance; the server state machine is authoritative.
Notification Verification
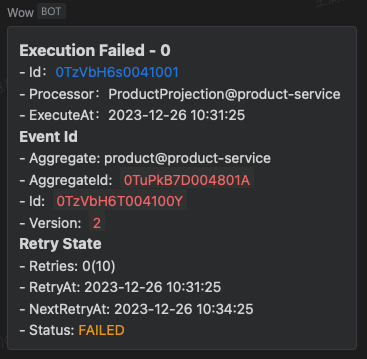
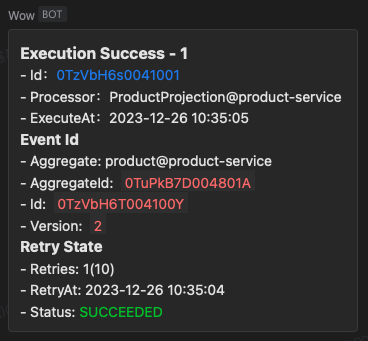
After configuring WeCom, use controlled failure and success events to verify bot delivery, quick-navigation links, and sensitive-data boundaries. Successful WebHook delivery proves notification reachability only; reconcile authoritative state in the Dashboard or query result.
| Failure notification | Success notification |
|---|---|
 |  |
Durable Deployment and Verification
For a durable environment, keep the distribution's direct java startup path, configure real MongoDB, Redis, Kafka, scheduler, and notification infrastructure, and remove the local example's in-memory/disable overrides. The repository supplies the service host and Dashboard build, not a production-ready cluster policy.
The image reads /opt/wow-compensation-server/config/application.yaml, the distribution's src/dist/config/application.yaml, whose backends are all on localhost. A pod that misses one of these variables starts and points at localhost, so set every one of them (Spring maps each to the setting beside it):
| Variable | Setting |
|---|---|
SPRING_MONGODB_URI | spring.mongodb.uri (event streams and snapshots) |
SPRING_DATA_REDIS_URL | spring.data.redis.url (CosId machine ids) |
WOW_KAFKA_BOOTSTRAPSERVERS | wow.kafka.bootstrap-servers (command, event and state-event buses) |
SPRING_ELASTICSEARCH_URIS, SPRING_ELASTICSEARCH_USERNAME, SPRING_ELASTICSEARCH_PASSWORD | spring.elasticsearch.*, when events or snapshots are on Elasticsearch |
The image's HEALTHCHECK and the liveness probe read /actuator/health/liveness, which says only that the process runs; a backend that is down shows in /actuator/health. The template answers that endpoint with the status alone (show-details: when-authorized): its details name the backends, so read them on the operator network, or set management.endpoint.health.show-details there.
The smallest Kubernetes shape is below. An actual release and capacity check must determine the image digest, resources, replica count, and Secret names:
apiVersion: apps/v1
kind: Deployment
metadata:
  name: compensation-service
spec:
  replicas: 2
  selector:
    matchLabels:
      app: compensation-service
  template:
    metadata:
      labels:
        app: compensation-service
    spec:
      containers:
        - name: compensation-service
          image: <registry>/wow-compensation-server@sha256:<digest>
          envFrom:
            - secretRef:
                name: wow-compensation-secrets
          ports:
            - name: http
              containerPort: 8080
          readinessProbe:
            httpGet:
              path: /actuator/health/readiness
              port: http
          livenessProbe:
            httpGet:
              path: /actuator/health/liveness
              port: http
Deployment verification should include at least:
- pin an immutable image digest built from the selected Wow tag and use the same digest in test and production;
- inject messaging, storage, notification, and authentication credentials through Secrets;
- verify EventStore and SnapshotStore indexes, capacity, backup, and restore;
- verify readiness/liveness, scheduler mutex behavior, backlog, failure age, restart counts, and error logs;
- restrict the Dashboard and management endpoints to a protected operator network with TLS, authentication, fine-grained authorization, and audit;
- exercise normal, retryable, unrecoverable, idempotent, and operator-recovery paths in test before promoting the same image.
replicas: 2 does not prove high availability. Multiple replicas still depend on real failure verification of messaging, storage, and scheduler mutual exclusion.